Console
The console tab gives the user the possibility to interact with the Gateway, as long as it is connected to the the platform services (Broker and/or Asset Manager).
Here it is possible to have access to system messages, debug messages, real time events, wich can be filtered to show only the ones needed in the console window.
It is also possible to send commands, read/write datapoints and have access to the log files stored in the remote gateway.
Connections
The EdgeNode establishes connection to two different services:
- Broker
- Assets Manager (AM)
It may happen that the EdgeNode is offline (not connected to the Broker), but it is still connected to the Assets Manager, and this will still allow to perform some actions on the remote EdgeNode.
Depending on if any of these connections are established or not, the options available in the console will be/not be available.
Broker
This is the connection that allows data to flow from the EdgeNode to the Cloud Platform and vice-versa. The data flowing on connection is:
- Real Time data
- Historical Data
- Configuration Deploy
Assets Manager
This is the connection that allows management and interaction with the EdgeNode using:
- System Commands
- Request logs
- Perform firmware upgrades
- Etc.
When navigating to the Console, the user will see a message in the console window with the AM connection status.
You can also perform the command “Get Status” to check this information.
Filter log
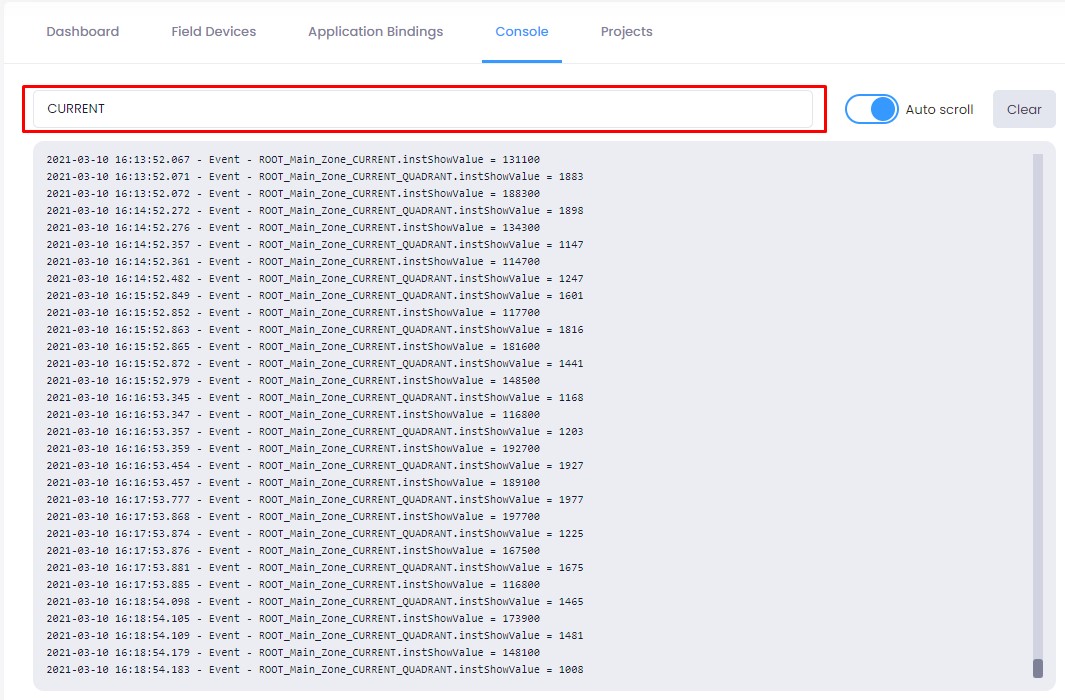
At the top of the console window, you can find the Filter log text box.
The Filter log allows the user to filter which System messages or Realtime events are shown in the console window.
This is particularly usefull when trying to see events from a specific device or datapoint in the inumerous events being presented in the console window.
It can be used the full idname of the datapoint, or sections of the idname.
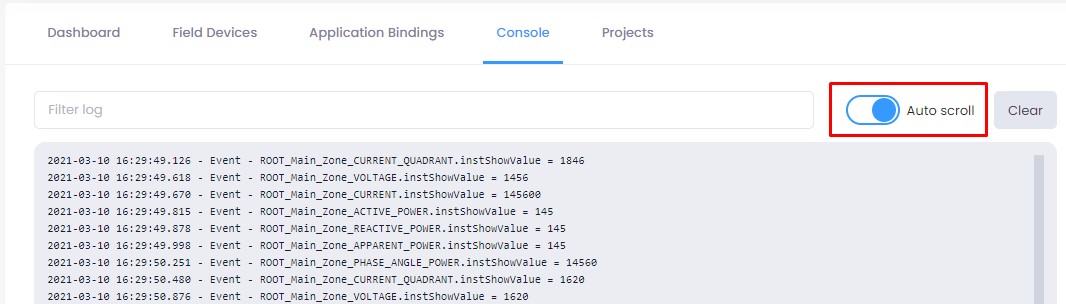
Auto scroll
Auto scroll is an option that allows to activate or deactivate auto scrolling in the console window.
When activated, the latest System message or Reatime event is made visible in the console window, while when deactivated, the latest messages will keep being printed in teh console, but will not be made visible. the user has to scrool manualy to see thos e messages.
Clear
Clear button will clear all messages in the console window.
![]()
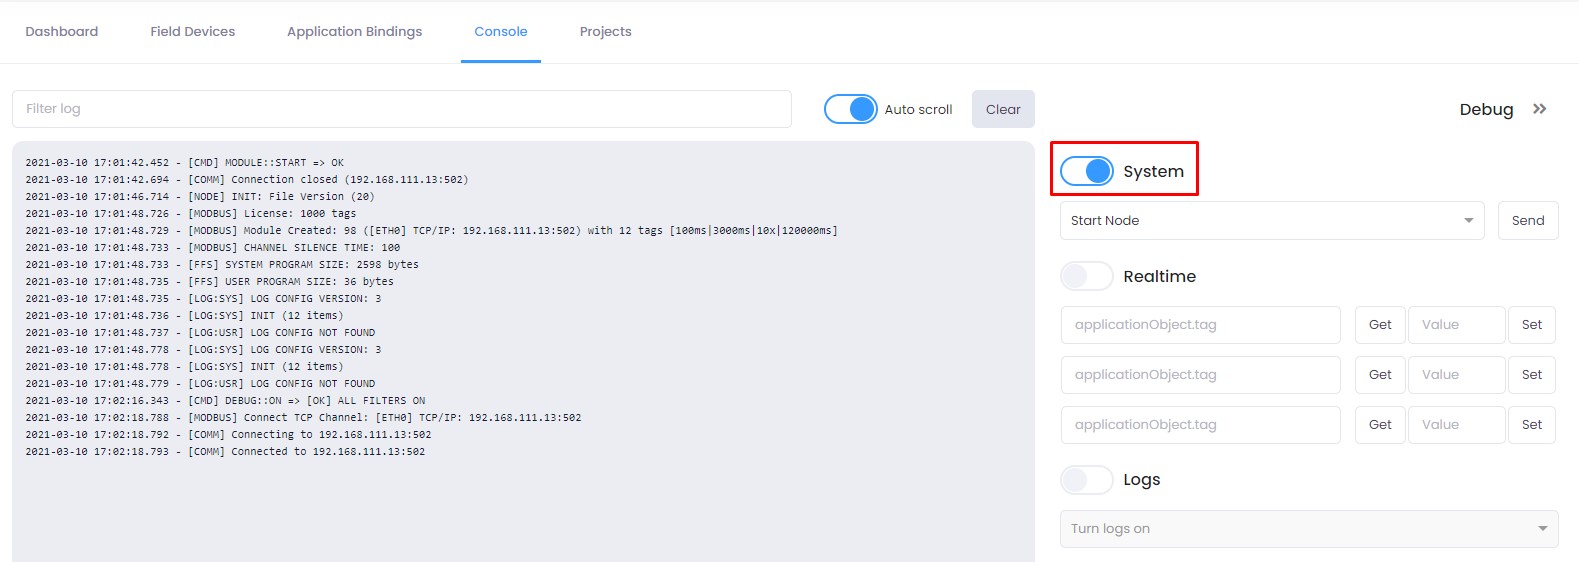
System
The System slide button, allows to activate the System Messages from the remote gateway.
These messages can be communication establishment with remote devices, like Modbus, KNXnet/IP, BACnet, Pofinet, Profibus devices, Cloud Servers, Mobile communications info like signal strength and traffic, etc.
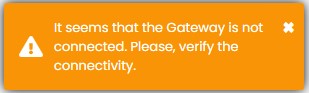
If the EdgeNode is not connected to the AM, it won’t be possible to activate System and gets the following message.
System Commands
Activating System messages also allows the option to send commands to the remote gateway.
The available commands are:
| Command | Description | Observation |
|---|---|---|
| Start Node | Performs a Start command on the EdgeNode | Starts the execution of the EdgeNode without restarting the host gateway |
| Stop Node | Performs a Stop command on the EdgeNode | Stops the execution of the EdgeNode without shutting down the host gateway |
| Restart Node | Performs a Restart command on the EdgeNode | Restarts the execution of the EdgeNode without restarting the host gateway |
| Reboot Host | Performs a Reboot in the host gateway | Reboots the host gateway, the same way as reboot |
| Host Status | Prints in the console window the status of the Host gateway | Same result as top command in the host |
| List Files | Prints in the console window the list of all files in the EdgeNode directory | List all files from the directory. Same as ls |
| List Connectors | Prints in the console window the list of all installed connector libraries | List all files from the xlibs directory. Same as ls /xlibs |
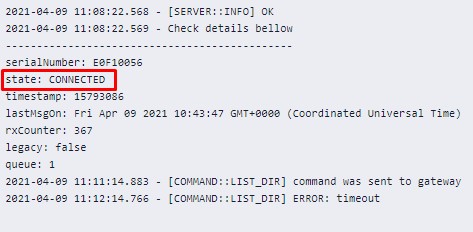
| Get Status | Prints in the console window a list of parameters that indicates the status of the remote EdgeNode | Parameters: serialNumber, state, lastMsgOn, rxCounter, legacy, queue |
| Clear Commands | Clears all the messages in queue in the remote EdgeNode | When commands are not executed, e.g. if remote EdgeNOde is not online, they are kept in queue. With this command the queue can be cleared. |
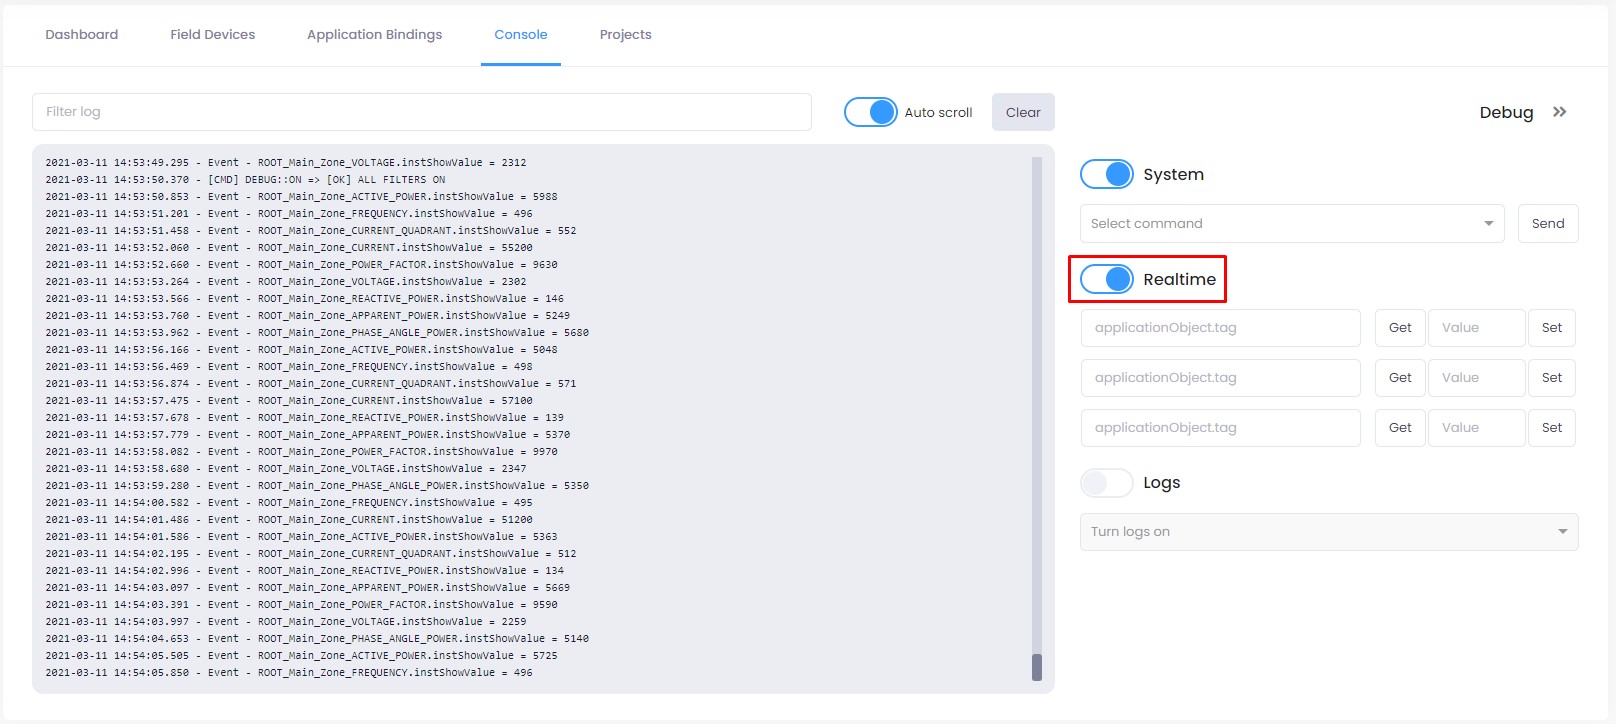
Real Time
Realtime slide button allows the user to activate realtime events from the remote gateway. When activated, the console window will show all events being generated by all datapoints, with timestamp.
If the EdgeNode is offline, the user won’t be able to activate Real Time and gets the following message.
With this mode enabled all the values from the devices will appear in the console
Get and Set
When Reatime data is activated, it is also possible to perform get and/or set commands to the gateway’s datapoints. This allows to read a value of a specific Datatpoint or to change its value. This functionality can be used to test datapoints, if necessary.
1. Stop the AutoScroll. This will help you to copy the datapoint idname.
2. Copy the datapoint idname.member from the console and paste it in the text box on the right.
Example: ROOT_Main_Zone_CURRENT.instShowValue
2. Now we can click to “Get” the value or write a new value on this device.
The event will show up in the console window.
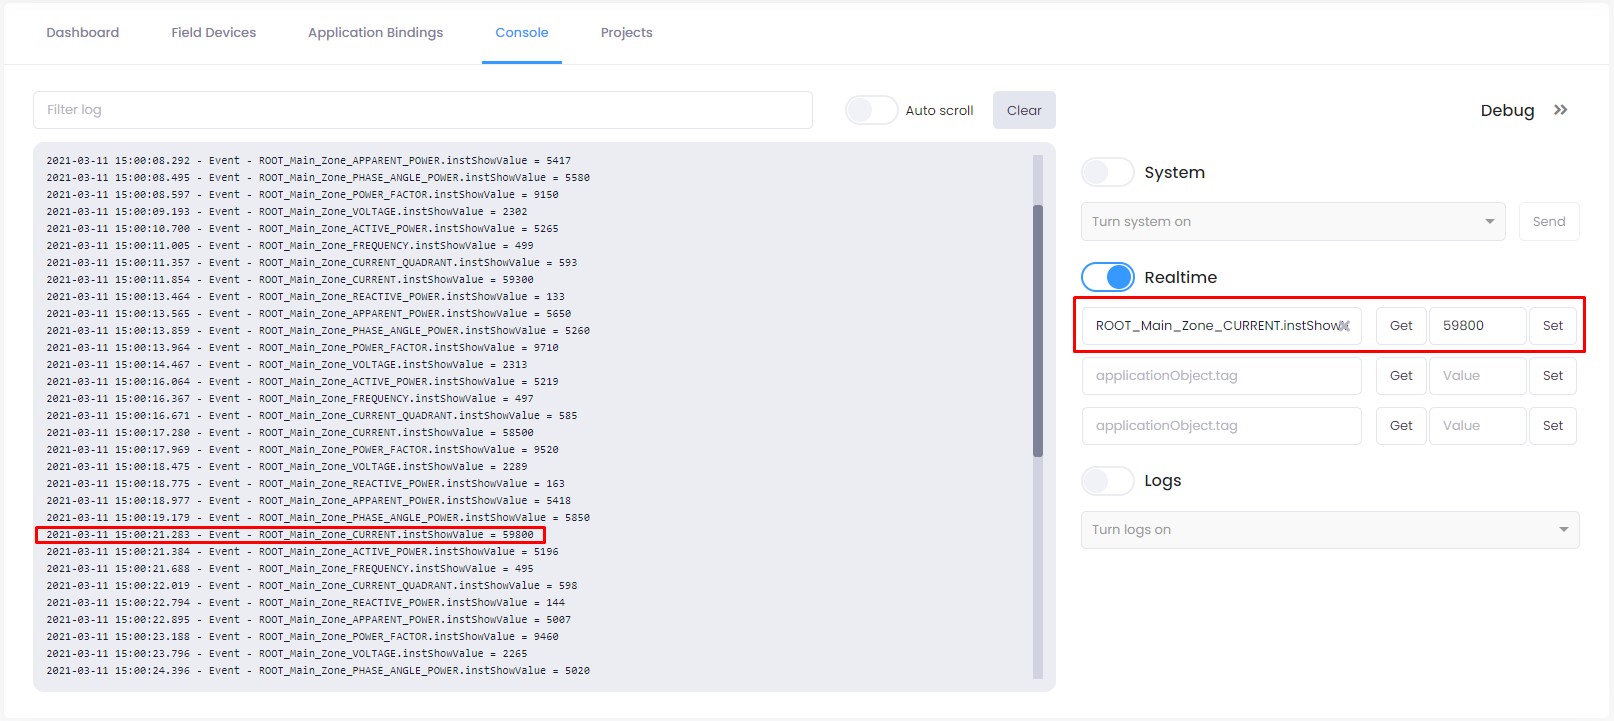
To perform a Set, follow the same steps, but insert the value in the “Value” text box and click “Set”.
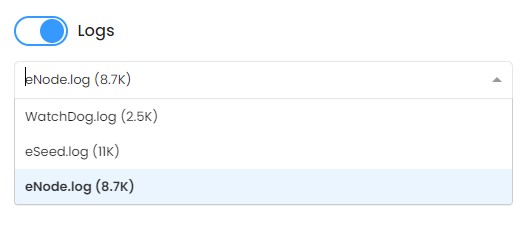
Logs
Logs option allows the user to access the log files in the remote gateway.
The available log files are the following:
| Command | Description | Observation |
|---|---|---|
| eNode.log | Log file for the EdgeNode | This includes information about the EdgeNode functioning, like connections to remote devices, connection to servers, startup messages, etc. |
| eSeed.log | Log file for the Seed | This includes information about the Seed functioning, like Asset Manager (AM) status, MQTT, EdgeNode, etc. For |
| Watchdog.log | Log file for the Watchdog | This includes information about the Watchdog functioning, like Seed status and watchdog status. |
To access the log files, follow these steps:
- Activate the Logs slide button.
- Select from the dropdown, the file you want to download.
If the EdgeNode is not connected to the AM, it won’t be possible to activate Logs and gets the following message.
- Then you have the option to choose how many lines to download from the file. The default is 100 lines.
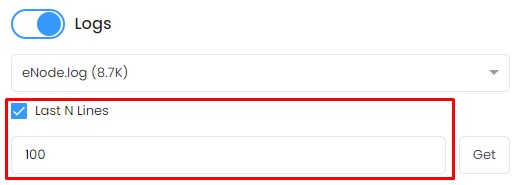
- Click the ‘Get’ button and save the file in a directory of your choice.